Dashboard
Company Dashboard
1. CRM Overview
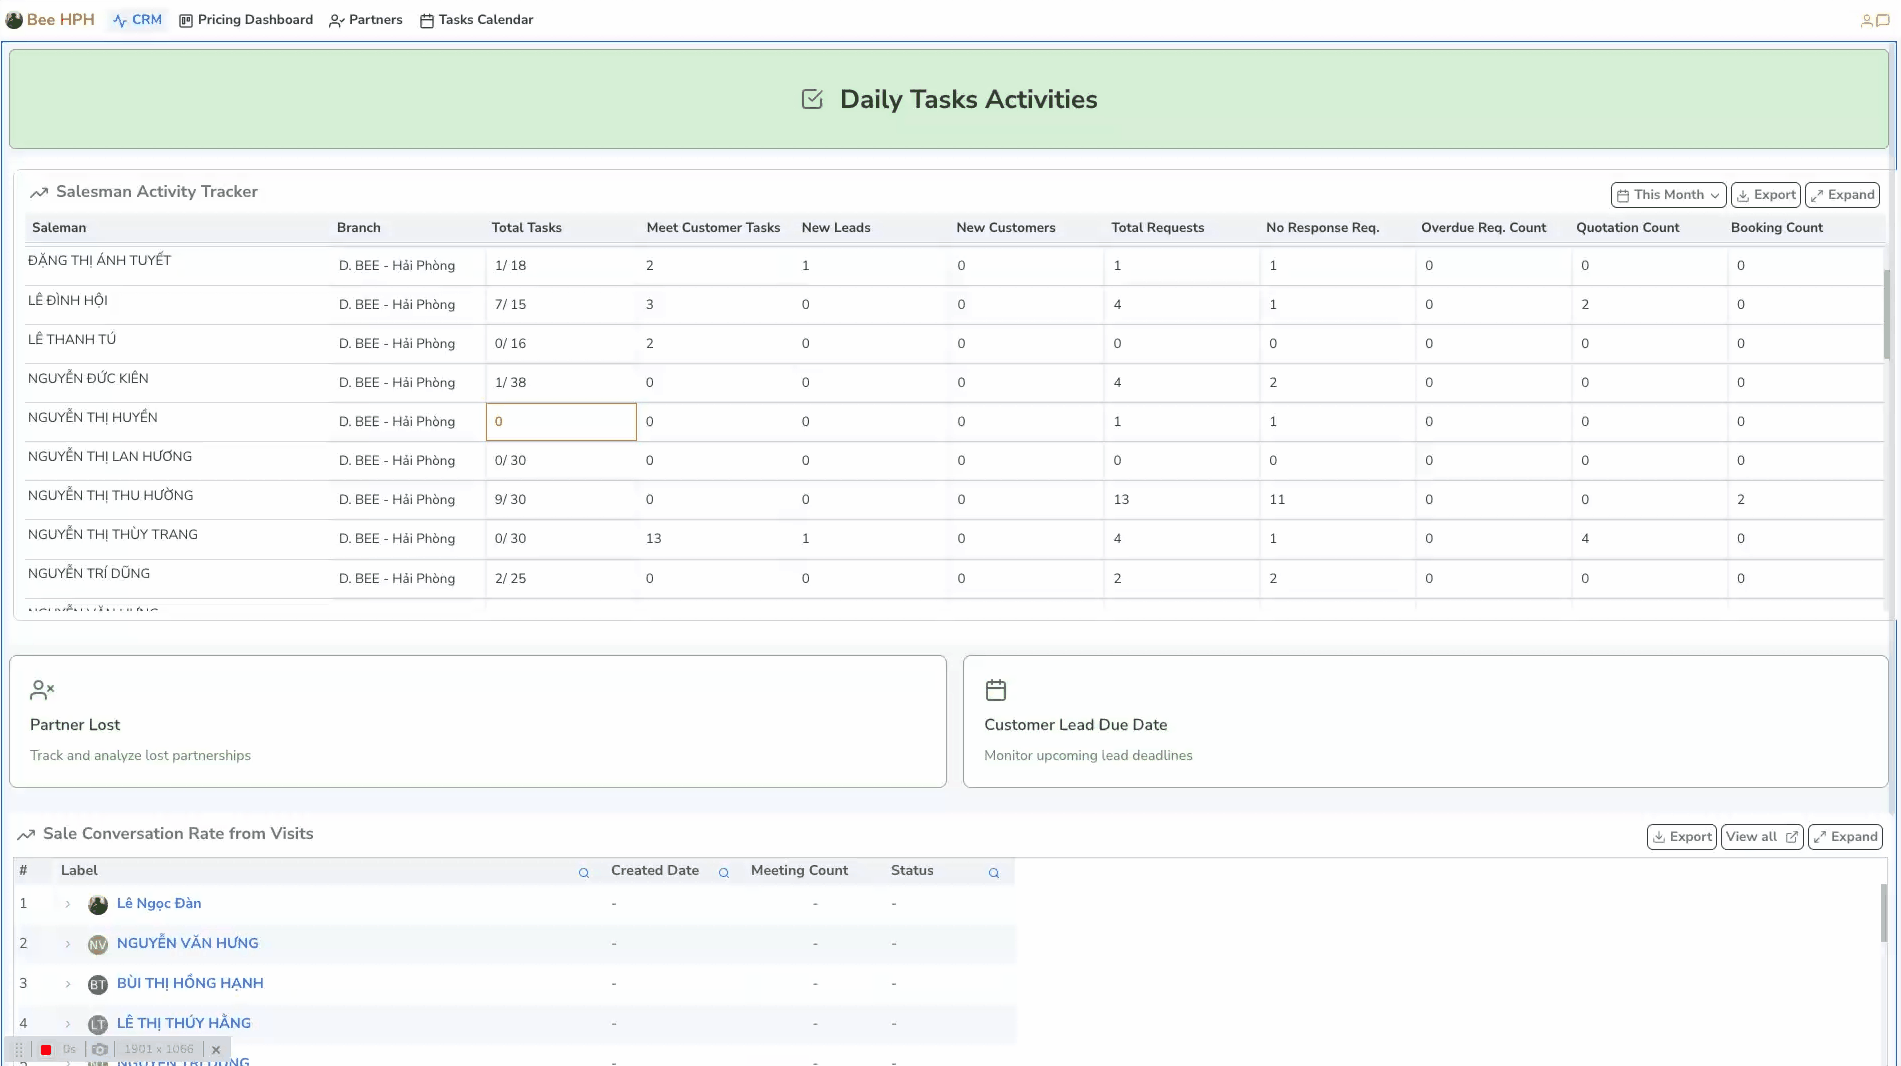
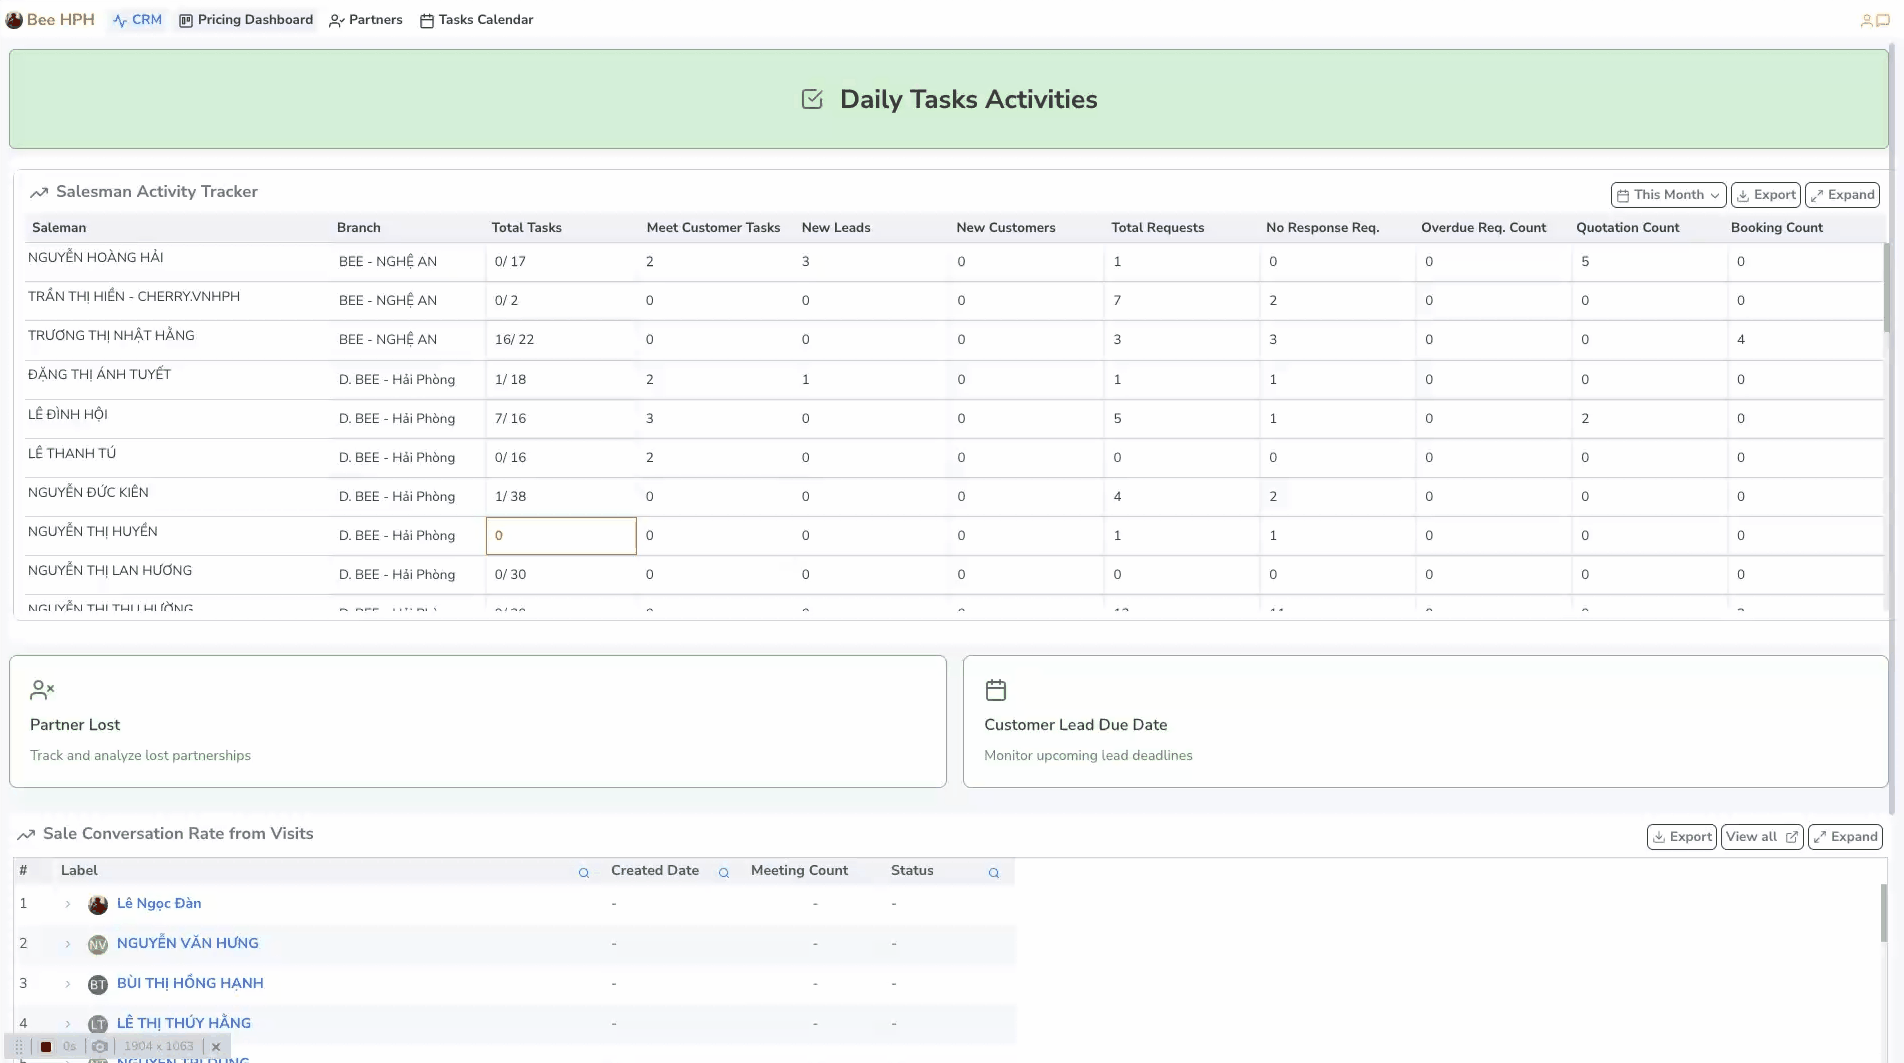
1.1. Daily Task: View sales staff activities, track progress, update status.

- All Tasks : List of sales staff tasks.
- Leads/ Customers : List of tasks related to customers and potential customers.
- Users Monitoring : Monitor user operations on CRM including metrics such as number of price searches, most searched routes, etc.
- Export Excel : Export Daily Task report to excel (Pending).
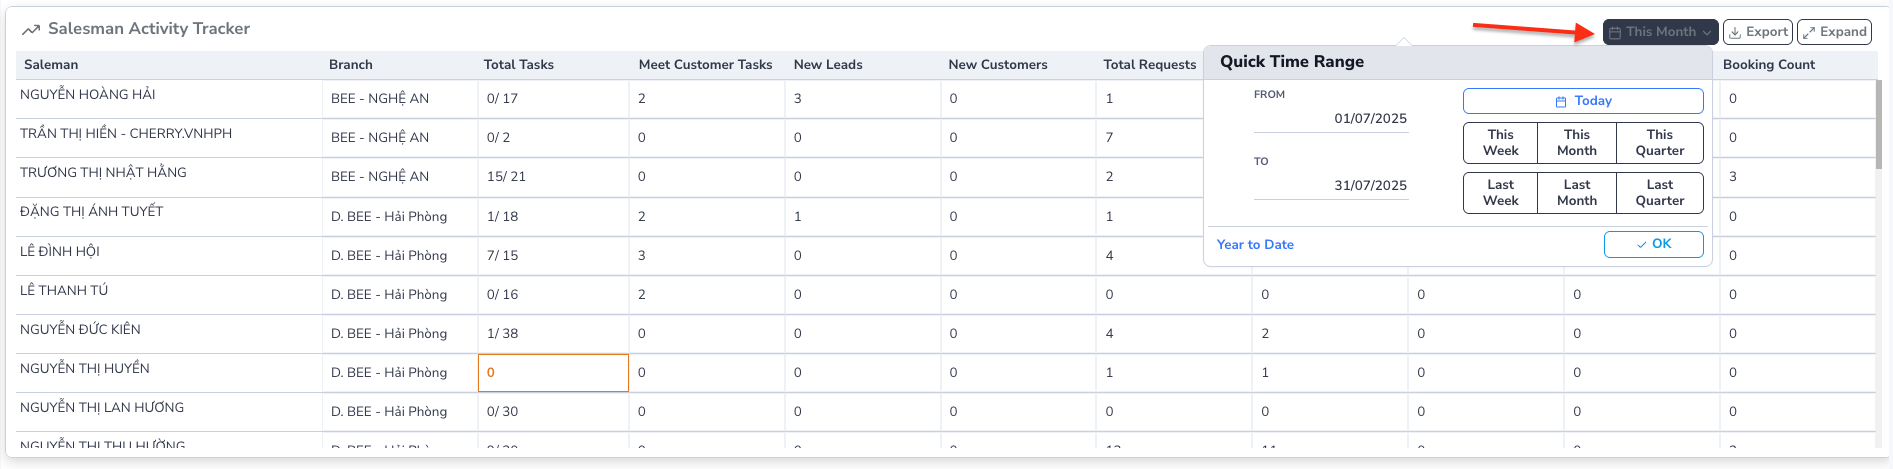
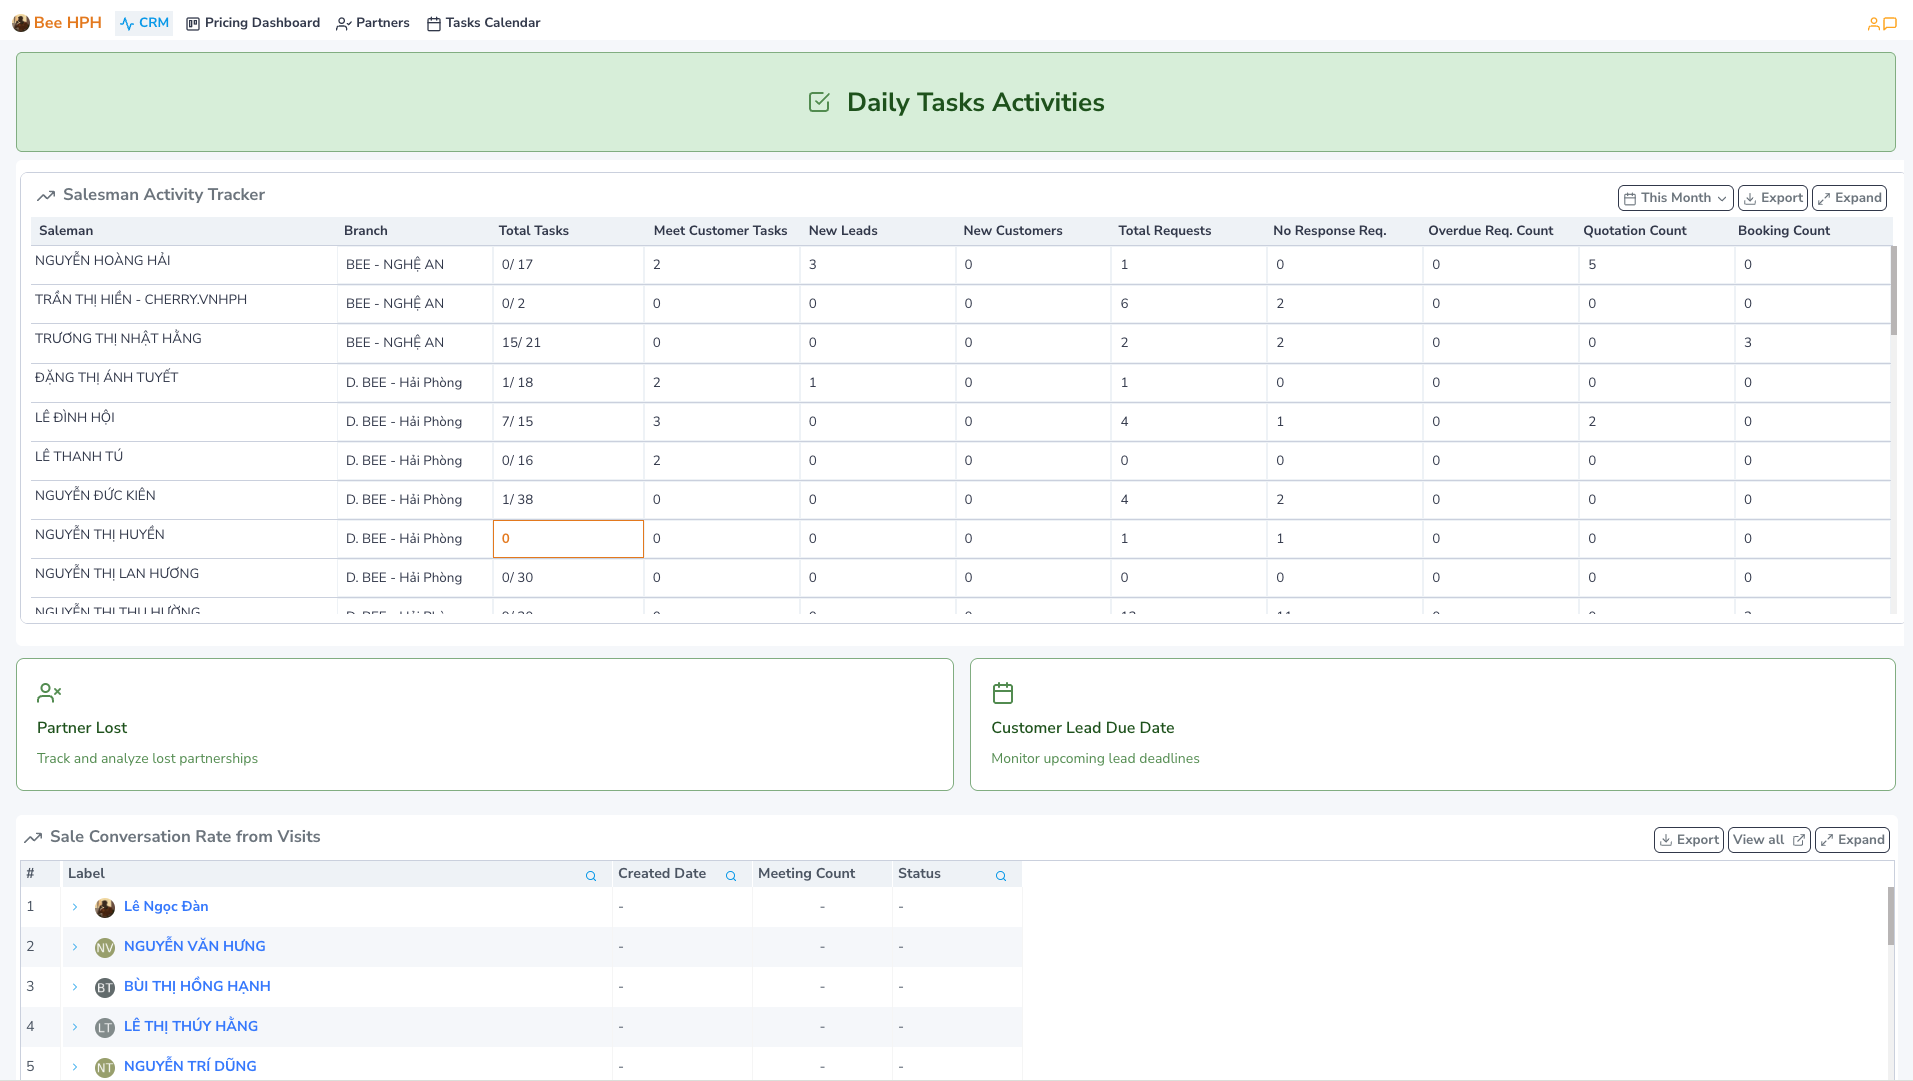
1.2. Salesman Activity Tracker. Summary of activity metrics for each employee, including:
- Saleman/ Branch : Sales staff information and branch they work for.
- Total Tasks : Total number of tasks - aggregated from
Daily Tasks (In Progress / Total). - Meet Customer Tasks : Total number of meeting customers tasks - aggregated from
Daily Tasks. - New Leads/ New Customers: Total number of new customers (Create CS or Permission from old CS) and new leads (Created on CRM system).
- Total Requests: Total inquiry requests collected from the system. (Including requests for price checking sent to pricing and requests automatically created when creating quotations).
- No Response Req.: Number of requests not yet responded to by customers, not yet updated to Win/Mismatch/... status.
- Overdue Req. Count.: Number of times the system sent reminder emails for late customer response updates.
- Overdue Req. Count.: Number of times the system sent reminder emails for late customer response updates.
- Quotation Count.: Number of times quotations were exported from the system.
- Booking Count.: Number of times internal booking was successfully created.
By default, the software will load the current month's report. Select report time by clicking the This Month button -> select custom time
For some metrics, you can click to view detailed data.
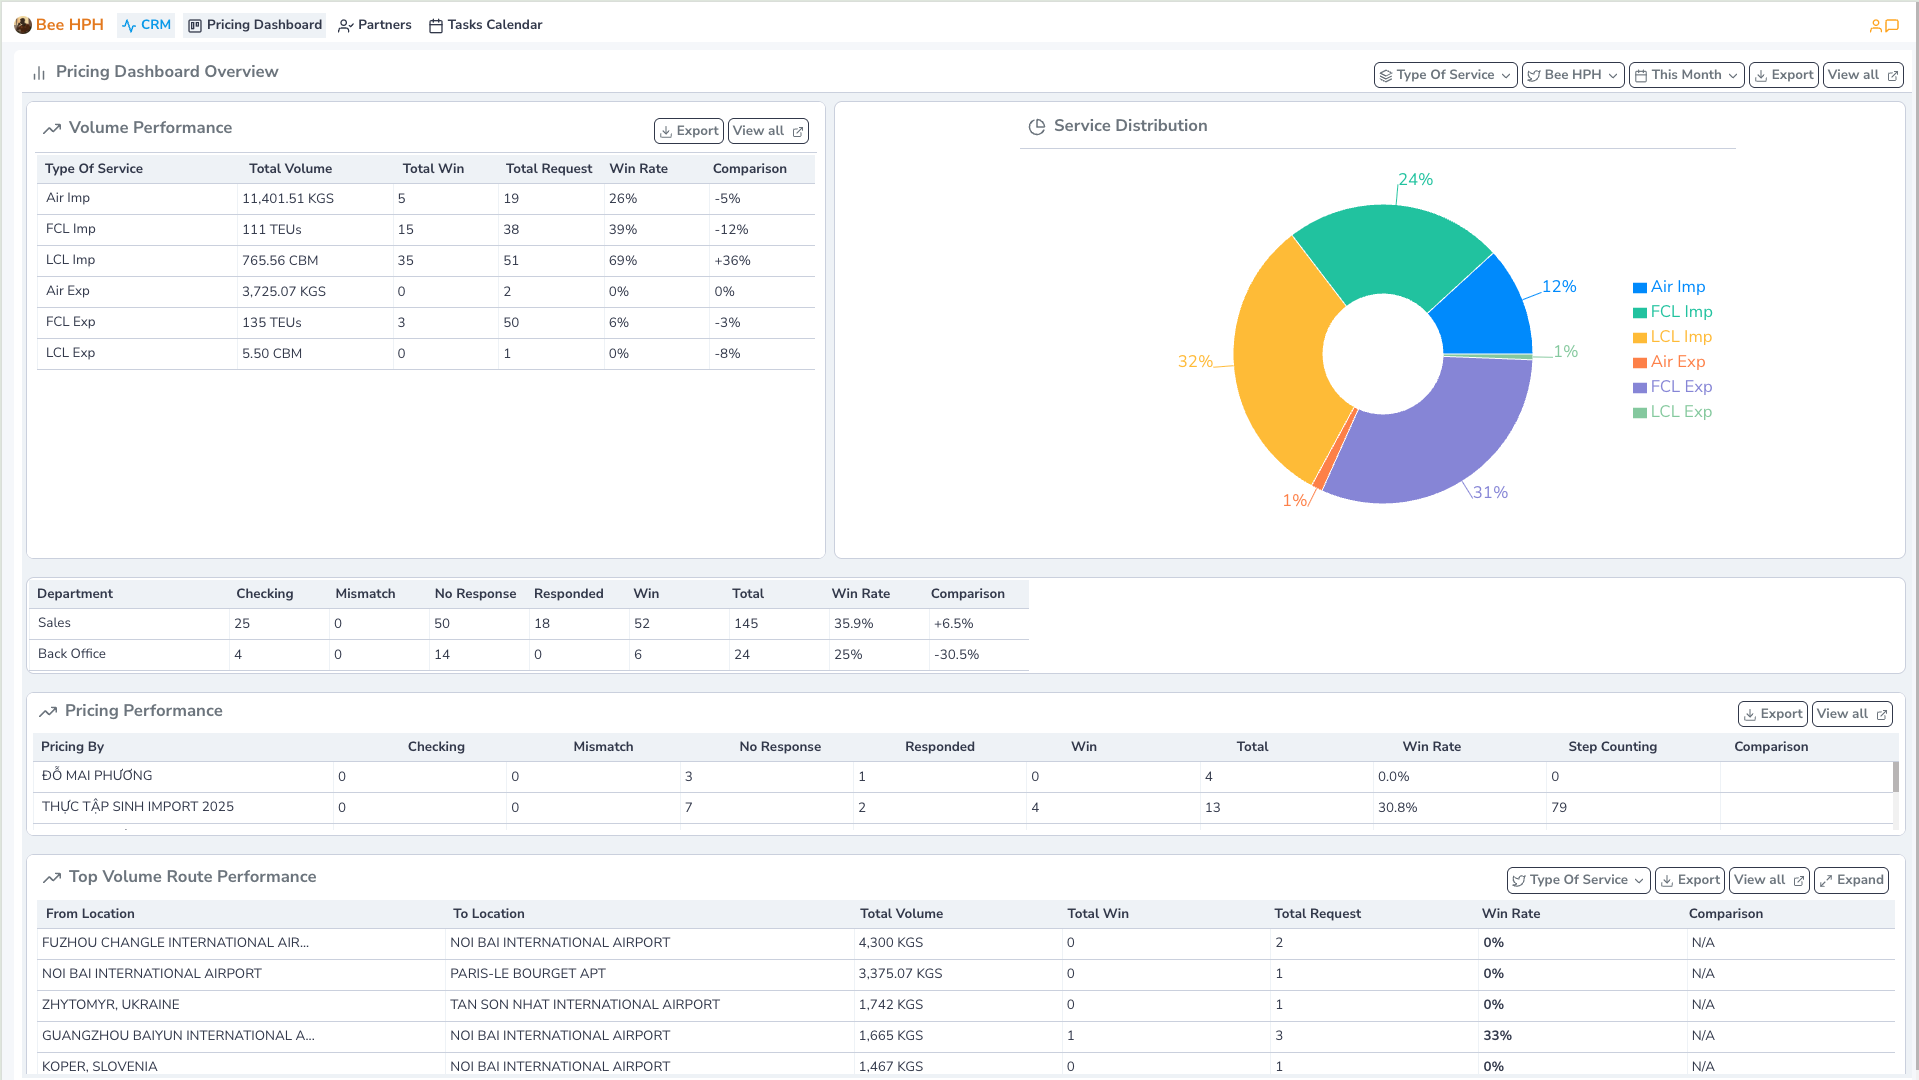
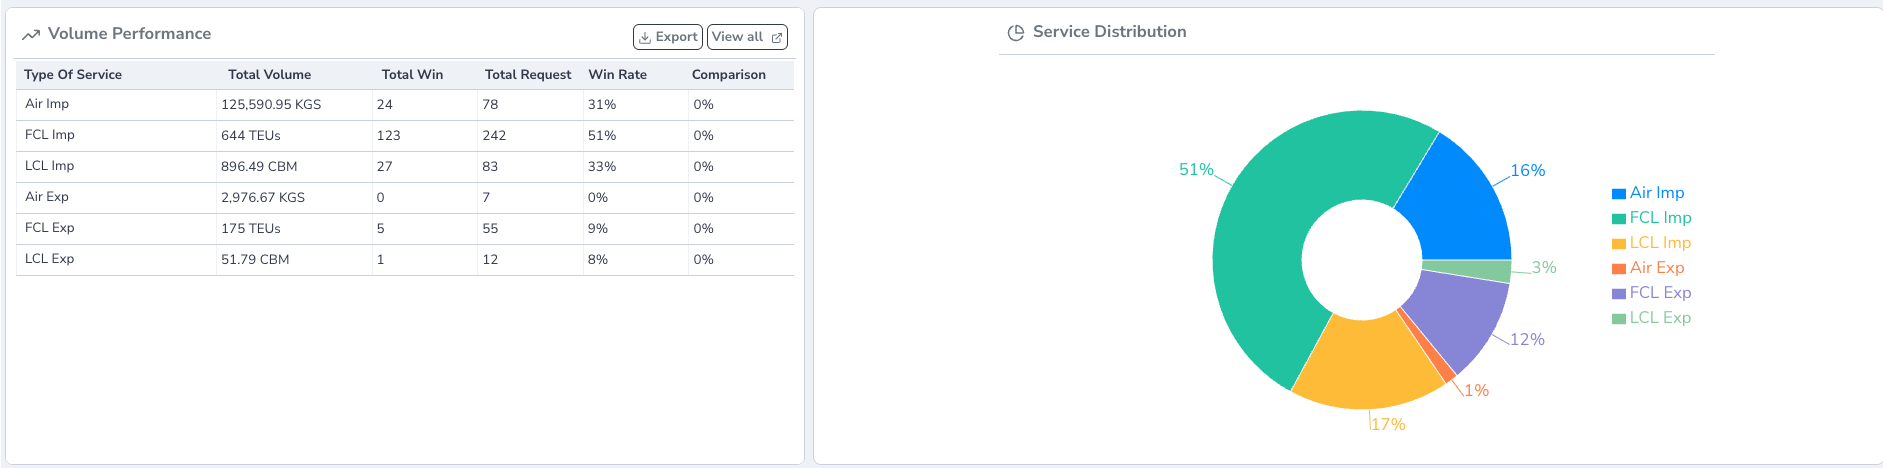
2. Pricing Dashboard
View status reports, win rate/volume Inquiry by different dimensions such as service, route, salesman, pricing.
On the toolbar, select Pricing Dashboard.
Support function bar includes:
- Type Of Service : Filter by service type.
- Bee HPH : Select company/branch to view data (Default displays branch according to user login).
- This Month : Select report time. (Default loads current month's report).
- View all : View raw data, all Inquiry Requests data.
1.1. Volume Performance: View volume summary by each service type.
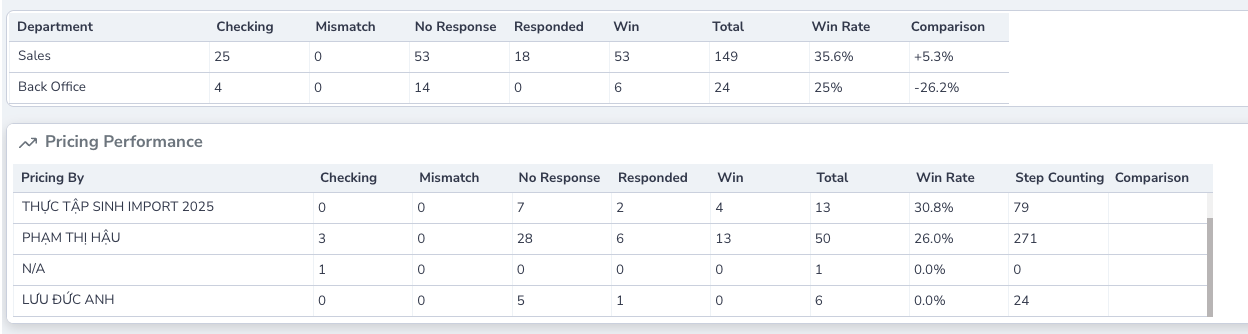
1.2. Department/ Pricing Performance: View volume summary by each department, or by each Pricing Specialist.
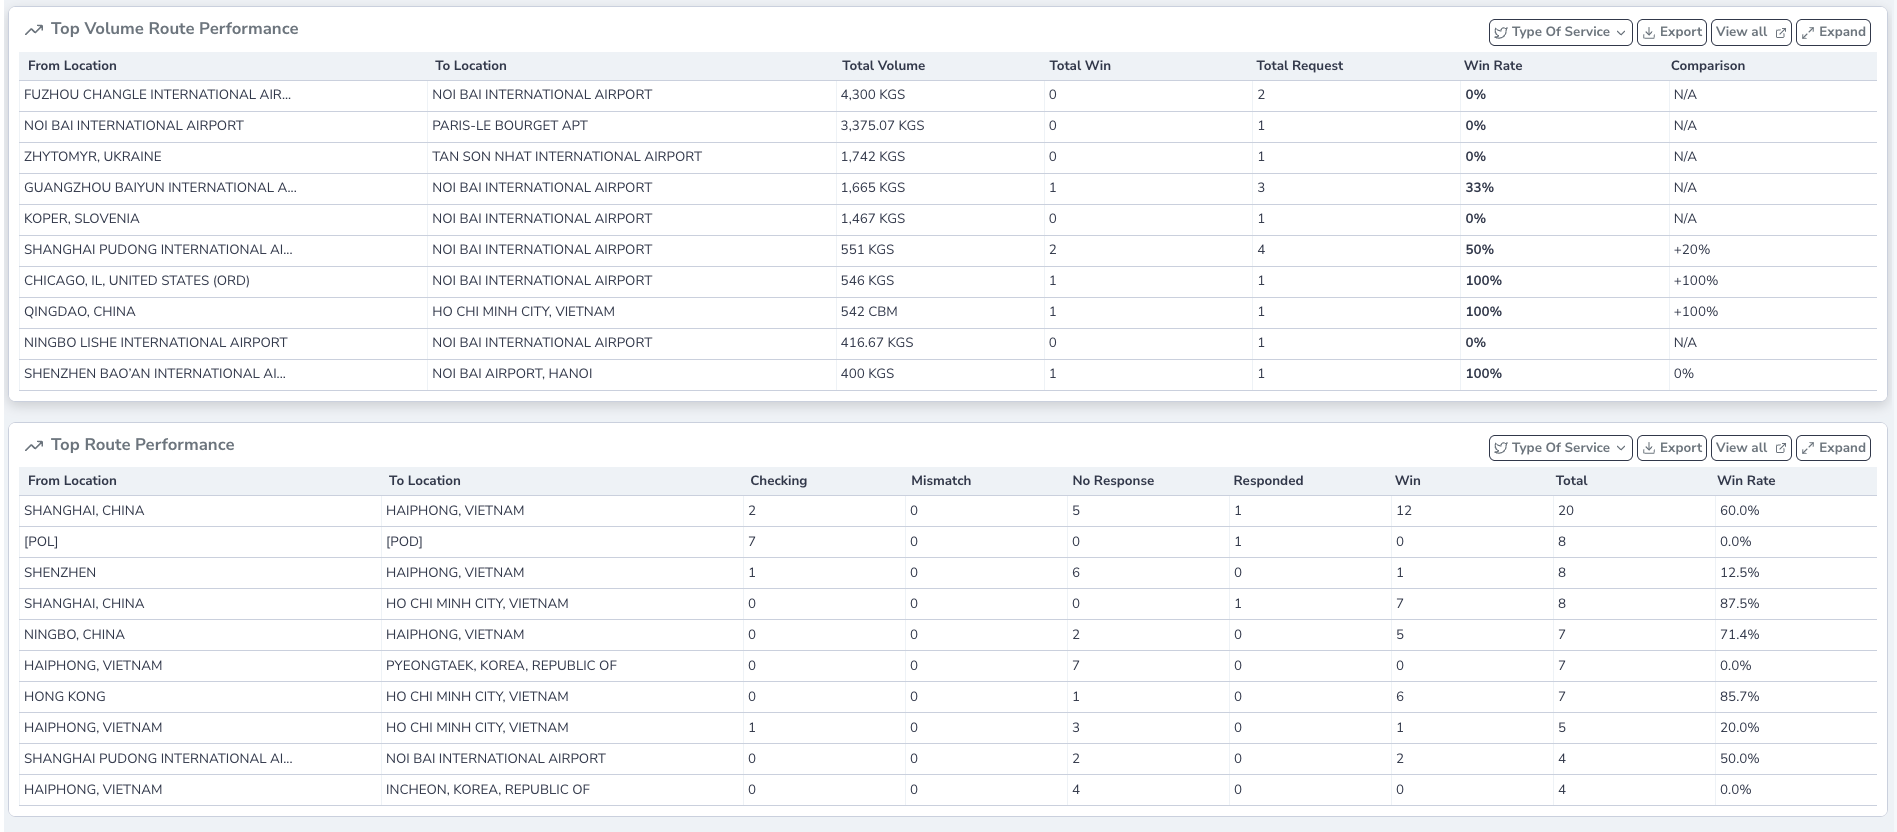
1.3. Top Volume/ Top Route: View volume summary, win rate by each route.
3. Partner Overview
See detailed instructions here
Admin Dashboard
Admin - CRM Overview
1. CRM Overview
- Similar to
Company Dashboard - CRM Overview, but shows the overall view of the entire company, not limited by branch.
Admin - Pricing Overview
2. Pricing Overview
- Similar to
Company Dashboard - Pricing Dashboard, but shows the overall view of the entire company, not limited by branch.